2022 in the Rear View Mirror
Inflation, the Fed’s response and rising interest rates, a sharp falloff in stock and bond prices, uncertainty of a looming recession and Cryptocurrency implosion were all part of the investment landscape in 2022. Although we don’t know what’s ahead, glad this year is behind us.

Inflation and Interest Rates
Inflation and the Fed’s response dominated the investment environment. 2022 saw the inflationary effects of prior years’ stimulus payments, supply chain disruptions, war in Ukraine, and an accommodative Fed – too much money chasing too few goods. The pattern of inflation, measured by prior year changes in the CPI, is shown in the accompanying chart. Throughout the past year, the Fed worked to bring inflation in check without triggering a recession. While some would argue a little late, the Fed ratcheted up the Federal Funds Target rate continuously from 0.75% to 4.50%. While it is too early to declare victory, a quick look at its recent trajectory shows the pattern of our measure of inflation bending in the right direction.

The rising interest rates in 2022 are seen in changing Yield Curves. (Yield Curves show the pattern of returns for holding various Treasury securities to maturity. Generally short-term yields respond to monetary policy; longer-term yields reflect market expectation for future interest rates.) The upward push in yields moved bond prices and returns lower – an index of long-term bonds was down over 14% in 2022. The December 2022 curve showing an upward slope for shorter intervals, then falling off is especially noteworthy. The short run pattern is consistent with the Fed’s continued tightening. The downward slope beyond a year projects interest rates to fall. Often this shape is explained by an anticipated need for an accommodative monetary policy down the road to spur economic growth in a recessionary environment. A more optimistic reason might be an expected reduction in inflation. We’ll see.

Stocks
Although the recent quarter was positive, 2022 was a down year for stocks, reflecting emerging inflation, increasing economic uncertainty and rising interest rates. A globally diversified stock portfolio finished the year down 18% – a sharp and unsettling change from recent market trajectories.

Stock price reflects the present value of expected future cash flows – as interest rates increase present values (prices) fall. The farther away are the cash flows, the greater the impact of interest rate changes on prices. Consequently, growth stocks lagged value stocks in 2022. Domestic tech stocks were especially hard hit – an equally weighted portfolio of Apple, Microsoft, Amazon, Google and Meta (Facebook) was down nearly 40%.

Inflation and the Fed’s response produced surprises and market volatility in 2022. No doubt we are in store for surprises going forward, some may even be positive.

Cryptocurrency
The Cryptocurrency phenomenon seems to be unwinding. Bitcoin, the most popular of the lot, fell by almost 70%. The Cryptocurrency exchange, FTX, blew up. While it appears the cause of FTX is simple fraud, greed and embezzlement, it prompted a discussion of the Cryptocurrency technology and its expected role going forward. There are two technologies involved – Cryptocurrency as money and “blockchain” to keep track of transactions. It is hard to imagine Bitcoin, or any other Cryptocurrency as money. After 14 years, Bitcoin is nowhere near a meaningful medium of exchange. Its volatility precludes Cryptocurrency as a store of value or unit of account. Blockchain technology was developed to keep track of Cryptocurrency transactions and holdings. While blockchain technology may eventually prove to be useful in certain roles, keeping track of Cryptocurrencies will not be one.

MARKET COMMENTARY

Stocks

After this week’s ups and downs, stocks ended November up nicely – international and emerging market stocks leading the way earning 11% and 15%, respectively. While not as robust, domestic large cap markets were up 6% and small-company markets returned 2%. These results bring the quarter-to-date returns to 14% for domestic markets, 17% for developed international markets and 11% for emerging markets – a welcome improvement over the first three quarters and consistent with a generally improving economic outlook.

Value markets – both domestic and international – are trading at premiums to broad markets. Year-to-date, the value premium in domestic markets was nearly 12%, in international markets just under 8%. Prices of value stocks reflect earnings from assets in place and less from future investments. These stocks are generally identified by relatively low price earning ratios. Because earnings are not as far off, increasing interest rates have a smaller impact on prices of value stocks and help to explain recent premiums.

Stock prices reflect the future, which is always unknown. The recent upswing is surely positive, but uncertainty remains. No doubt there will be surprises ahead.

Bonds

Yields on bonds at the short end moved up the last month, reflecting the push by the Fed to increase Federal Funds rates. Yields at the longer end were down a bit as well. Yields peak at one-year maturity and fall off to 3.8% at five years. This sharp inversion indicates lower interest rates ahead and often predicts a recession. The spread between real (inflation-adjusted) and nominal yields at both five- and ten-year maturities (about 2.3%) is consistent with the Fed’s long-term inflation objectives.

A Perspective on Inflation

Inflation can often be explained by too much money chasing too few goods. This description is consistent with the recent economic environment. One source of too much money is the massive stimulus payments made in 2021 to counteract the impact of Covid. These payments become inflationary if they exceed what is necessary to bring the economy to full capacity. The disruptions in the supply chain throughout the pandemic, and constraints in energy supplies from the invasion of Ukraine, meant too few goods. Additionally, throughout this period the Fed was especially accommodative. That inflation resulted should not be a surprise.

The landscape looks different today. Stimulus payments are beginning to work through the economy; supplies are more readily available; embargos seem to have reached a “steady-state,” and; the Fed is committed to being more restrictive. All of which should dampen inflation pressures. The bond market continues to signal benign inflation expectations. Stock markets appear to anticipate a more relaxed interest rate environment, which helps to explain recent positive stock markets.Yet, there are risks with this improving outlook: fiscal and monetary policies can overshoot the mark and either trigger a serious recession or reignite inflation; inflation becomes expected, and consequently, embedded in future transactions and self-fulfilling; and labor markets continue to tighten, driving up wages. Uncertainty remains, and it is reasonable to expect market ups and downs as this future unfolds. Yet, the current inflation and interest rate environment appears to be improving.

WHO WE ARE

Rockbridge Institutional serves the unique needs of institutions, foundations, and endowments by applying a disciplined, proven and responsible investment philosophy. We are intimately familiar with the challenges boards face as we serve on boards and finance committees ourselves.

We are committed to investment ideas that are grounded in academic research. The essence of our investment philosophy is that capital markets work in the long run; a portfolio’s risk is defined by its allocation among asset classes; and that security selection is a matter of constructing portfolios with specific expected return/risk characteristics at the lowest cost.

MARKET COMMENTARY

Stocks

Except for emerging markets, stocks were up in October. Domestic markets led the way – large cap (S&P 500) up 9%; small cap (Russell 2000) up 11%. International developed markets (EAFE Index) were up 5%, while emerging markets (MSCI Index) were off 3% due to sharply negative results in China. While uncertainty remains, October is a welcome change.

Bonds

Bond yields were up, especially at the short end. Yields at 1-year maturity are 4.5%, up 0.4%; 1- month and 3-month yields are up 1.0% and 0.8%, respectively. Yields on the 10-year are up just 0.2%-4.0%. Returns move inversely with yield changes, which explains losses in October. The Yield curve stayed inverted (1-year yields exceeding 10-year yields by 0.5%), which is often associated with a recession down the road. The spread between nominal and real yields (inflation adjusted) – a reasonable measure of the market’s expectation for future inflation – remains at 2.5% for 5-year maturities.

WHY INTERNATIONAL MARKETS?

Over the last 10 years the largest companies traded in international stock markets (EAFE) earned a real return (inflation adjusted) of just 3%, while domestic stocks (S&P 500) earned 11%. An international allocation has been a drag and raises the question of the title. Yet, if the goal is to build an efficient global portfolio – one with the best expected long-term trade-off of risk and expected return – then international stocks belong.

To begin to look at international stocks, we need measures of how markets are expected to behave. Unfortunately, neither we nor anyone else can reliably predict future markets – the best we can do is come up with a reasonable description that includes not only an expected payoff, but also a range of possible outcomes. Past market behavior provides a clue. Over the past 42 years there are 168 rolling 10-year periods. While I think recent periods distort the picture, and making no adjustments, the average 10-year returns are 7%; the standard deviation is 3%. This picture provides context for the most recent 10 years in international markets. If these statistics describe what we can expect from international markets, then the most recent 10 years is rare (5% probability).

Individual markets don’t all act together – when one is up, the other is apt to be down, and vice versa (e.g., over the same period domestic market returns were well above long-term averages). Because of this lack of perfect correlation, combining market results in the same expected return but with less volatility, the optimum portfolio will include an allocation to international markets, the recent past notwithstanding.

Unfortunately, the benefits of diversification are not always apparent. However, some comfort can be found in the idea of “regression to the mean.” This idea suggests that after a below-average period, to realize the average, future returns must be above the average and justifies sticking to an established strategy in the face of below-average results.

Investing risky assets is hard. It is a long-term process throughout which there will be a lot of short-term volatility. Success requires commitment and patience.

WHO WE ARE

Rockbridge Institutional serves the unique needs of institutions, foundations, and endowments by applying a disciplined, proven and responsible investment philosophy. We are intimately familiar with challenges boards face as we serve on boards and finance committees ourselves.

We are committed to investment ideas that are grounded in academic research. The essence of our investment philosophy is that capital markets work in the long run; a portfolio’s risk is defined by its allocation among asset classes; and that security selection is a matter of constructing portfolios with specific expected return/risk characteristics at the lowest cost.

August saw significant up and downs in stock returns.  In the first half of the month a global stock portfolio was up about 3%, then dropped 6% to a loss of almost 3% after Fed Chairman Powell publicly reaffirm its commitment to increasing interest rates until inflation is in check.  Domestic large cap equities were down over 4% – Google was down almost 18% – small company stocks off 2%.  While emerging markets were up a scratch, stocks traded in international developed markets were down nearly 5%. The variability of returns among markets as well as the volatility in the August numbers reflects the continued uncertainty associated with the Fed wringing out inflation while avoiding a recession. Expect this unpredictability of stock markets to continue.

Bond yields ratcheted up about 0.5% across most maturities in August.  The yield on the Bell weather 10-year Treasuries climbed 0.4% to 3.1%.  This nearly parallel upward shift in yields drove this month’s bond returns from losses of about 1% to almost 4% depending on maturity. Yields on both nominal and inflation protect Treasuries for 5 and 10-year maturities jumped about 0.5% in August maintaining a difference of about 2.5%, which is a reasonable measure of expected inflation over five and ten-year periods. Additionally, the shape of the Yield curved became even more inverted (1-year yields of 3.5% versus 10-year yields of 3.1%) in August.  A yield curve of this shape is oftentimes associated with a recession down the road.

So, signals from the bond market are a mixed bag – the shape of the yield curve indicates a recession ahead: the spread between nominal and real (inflation adjusted) 5 and 10-year yields shows expected inflation in line with the Fed’s targets. We’ll see.

The Consumer Price Index (CPI) climbed to a historically high 9% over the past twelve months prompting concerns for ongoing inflation. There is much discussion in the popular press as to the causes and to the extent it is “transitory” or is becoming embedded in economic activity. While the emergence of inflation contributes to market volatility, given the responses to the pandemic which include massive government stimulus payments, supply chain disruptions and an accommodative monetary policy coupled with a boycott of Russian oil due to its invasion of Ukraine it is not surprising that we are seeing significant price increases, which are having a negative effect on many people’s personal spending decisions.

The longer-term worry is that inflation gets baked into a cycle of wage and price increases, which can be not only difficult to deal with, but painful to break. In the meantime, the Fed has been increasing interest rates. Our usual models often tell us that rising interest rates will have a negative impact on growth. Currently the employment numbers remain positive. Regardless, this expected conflict between inflation and growth, plus the difficulty with measuring economic activity is a source of uncertainty in today’s markets. While July’s results were pleasant, expect continued market volatility.

After a sharp decline in the first six months of this year, stocks were up nicely in July; a global equity portfolio was up just over 6%. These results were a welcome respite from what we have experienced thus far this year. Markets look to the future. Let us hope they signal positive expectations for the Fed tamping down inflation while avoiding a recession. Uncertainty remains, but an upbeat month is a welcomed change, nonetheless.

Yields were up at the short end, but down a bit for longer maturing bonds in July. These twists in the yield curve are consistent with the Fed increasing the short-term interest rates it controls coupled with reasonable inflation expectations over extended periods. The spread between nominal and inflation protected yields continue to signal inflation in the range of 2.5% over five and ten-year periods.

First quarter measures of Gross Domestic Product (GDP) and National Income, which ought to equal, provide conflicting indications whether we are in a recession. Employment numbers continue to be positive. Keep in mind that the economy is coming out of a 100-year pandemic – we should take measures of economic activity with a “grain of salt”. Although they can change quickly, signals from stock and bond markets are positive.

Stock Markets

Although rebounding lately, all markets are down year to date. Since December stock markets are off more than 10%. Tech stocks are especially hard hit – an equally weighted portfolio of the largest domestic tech stocks (Apple, Microsoft, Amazon, Google, and Facebook) is off 25%. The premium to value markets, domestic and international, reemerged with year-to-date premiums of 9%.

These results are consistent with a murky future as markets seek to sort out the impact of the ongoing War in Ukraine and the Fed’s ability to thread the needle of tamping down inflation without triggering a recession. While stock prices are established by traders expecting positive results, there is no doubt prices will be volatile throughout this process. Going forward there will be plenty of surprises impacting stock prices one way then another. Yet, the observed price best reflects the news driving these surprises. Consequently, while difficult, it is especially important to maintain established commitments to ensure expected returns are realized.

Inflation is a concern. Over the past twelve months the Consumer Price Index (CPI) is up 7.5% – levels not seen since the early 1980’s. Whether this spike reflects government stimulus spending, or shortages due to disruptions in global supply chains, or some combination is not clear. The Fed has been increasing interest rates in response. Its success at bringing down inflation without triggering a recession remains uncertain.

Over longer periods, domestic market returns stand out, especially in large cap markets which reflect the extraordinary results of large tech stocks. Ten years is not a long time in markets. While these relative returns are useful to understanding short-term results in diversified portfolios, historical results are not useful for predicting the future. Periods of significant volatility oftentimes brings short-term regrets, which is OK if it doesn’t affect long-term decisions.

Bond Markets

Today’s pattern of bond yields versus those at the beginning of the year shows a marked increase at all maturities. Bond prices and returns move inversely with yield changes. The longer the period to maturity, the greater the move. This year-to-date upward shift helps to explain recent negative bond returns.

Yields are driven by interest rates, risk premiums and expected inflation. These factors shift through time resulting in changing yields and volatile bond market returns. If we isolate the effect of interest rates and risk by looking at nominal versus real Treasury yields of like maturities, then we have a view of expected inflation implied in today’s yields. This analysis produces expected inflation over the next five years of 3.0% and 2.6% over the next ten-years – not only different from what we have been observing, but also closer to the Fed’s objectives.

Uncertainties associated with activities of the Fed include (1) how fast and by how much it will increase interest rates to contain inflation and (2) how it will deal with the massive amount of Government securities on its balance sheet. At its recent meeting the Fed increased interest rates ¼%, announcing several more increases going forward. Its goal is to bring down inflation without triggering a recession. Expectations of the Fed’s success in achieving this goal will be reflected in both stock and bond markets going forward.

Every year large Wall Street firms publish their forecast of expected returns for the coming decade. The following table shows what each firm expects from capital markets in the coming 10-years.

The first thing that jumps out is the poor expected performance by U.S. equities. Despite averaging nearly 10% over the last 100 years, forecasters have returns in a range from 1.6% to 6.7% which an average of 3.5%.

It’s also worth noting how much better forecasters expect international stocks to perform compared to U.S. stocks. Every forecaster has international stocks outperforming U.S. stocks, the average difference being 2.5% with developed countries and 4% with emerging countries.

It stands to reason international stocks will outperform U.S. stocks by a bit as they are more volatile, but if the difference in returns is as large as these forecasters expect, portfolios heavy in international stocks will have greater risk-adjusted returns.

Expected returns for bonds have much less variability, with their 2% average coming in just above what the aggregate bond market is currently yielding.

These forecasters have been predicting international outperformance for several years now, but U.S. stocks keep stealing the show. Will the experts finally be right, or will domestic stocks continue to be the best? It’s anyone’s guess but these forecasts reinforce the importance of maintaining a globally diversified portfolio, with a meaningful allocation to international stocks.

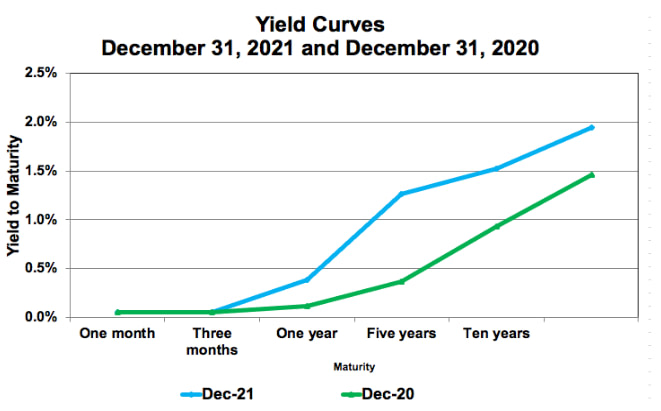
2021 was a good year for domestic stocks, with large-cap stocks (S&P500) up 29%. Returns in this market segment continue to be driven by the largest tech stocks, which had been the case for the last ten years. Results in other markets are mixed.REITs produced extraordinary returns bouncing back from last year’s sharp fall-off. Emerging markets, on the other hand, were down, primarily reflecting a slow down in China. A longer view, which includes the Coronavirus pandemic, shows that stock markets have rewarded investors. This consistent performance among most asset classes demonstrates that the best way to deal with short-term volatility is to remain committed and diversified across all market segments.

Inflation reared its ugly head in 2021. The Consumer Price Index (CPI) grew 6.6%, well above predictions and long-term averages. Supply chain bottlenecks and government stimulus payments are among the key factors blamed for the increased inflation.

Bond Markets

A Yield Curve shows the pattern of observed yields from holding bonds to term across several maturities. The graph at right shows today’s yields from essentially zero to 2% across a twenty-year maturity spectrum. Yields at these levels are consistent with the Fed’s commitment to keeping interest rates low.

Returns to bond investors in 2021 were negative, explained by the upward shift in the Yield Curve over the past year. The longer the maturity, the greater a given shift has on returns, which is the primary reason short-term bond returns were down a little less than 1% while longer-term returns are down between 2% and 3%. Note the “kink” in the curve at around five years. To resume its more normal shape either yields in the five-year range must come down (driving returns up) or yields on longer maturities must increase (pushing returns down).

The Year Ahead

Uncertainties in the year ahead include current stock valuations, inflation, and Fed activities. While there are plenty of forecasts in the popular press of what’s ahead, expectations for how these issues will affect markets are baked into today’s prices reflecting the best guesses of both buyers and sellers.

The S&P 500, which many view as the “Stock Market” (it is not) has had a great run. Historical pricing models and the idea of regression to the mean signal caution for the S&P 500. However, historical models can become obsolete and moving back to long-term averages can take a while confirming the futility of short-term predictions. Recent returns in other markets are closer to long-term averages, which, absent surprises, provide a reasonable expectation for 2022. One safe prediction is for continued volatility.

Inflation presents another uncertainty for 2022. Its effects will depend primarily on whether it’s “transitory” or not. Will the resolution of the current supply chain problems settle inflation? Or is inflation embedded in today’s economy due to excess cash from stimulus payments chasing too few goods coupled with an accommodative monetary policy? Perhaps inflation is more directly tied to a cost/push from labor market disruptions? Yet, markets seem to be signaling inflation at more typical long-term averages as today’s difference between nominal yields and yields on comparable inflation protected securities (TIPs) is a little more than 2%.

The Fed’s accommodative monetary policy over the past few years in response to the 2008 financial crisis and the Covid 19 Pandemic may have produced a moral hazard altering stock market risks but has also resulted in a massive amount of Treasury securities on the Fed’s balance sheet. The Fed is continuing to purchase Treasury securities, although at a reduced pace. There’s little history to help predict how these distortions will be resolved and the impact they will have on markets in 2022. This is uncharted territory, which is apt to produce surprises in 2022 and beyond.

The issues of stock market valuation, inflation and Fed policy are well-known. Their expected impact in 2022 is reflected in today’s prices – betting against these market signals usually does not produce good outcomes. Only time will tell.

Stock market returns were mixed in the third quarter. Microsoft, Google and Apple led returns in the domestic large-cap stock market; stocks traded in international developed markets and REITs were also positive. The riskier domestic small-cap and emerging market stocks posted negative results, which dragged a portfolio diversified among all these markets down over 2% this quarter.

On the other hand, over the past year, we saw results that were well-above long-term averages. One-year returns from emerging markets range from 18% to nearly 50% in domestic small-cap markets. While clearly a great period and necessary to offset the sharp fall off in the first quarter of 2020, these one-year returns are not sustainable.

Equity investors with a sustained allocation were rewarded over longer periods as each of these markets earned a consistent return of about 11% in each of the three-, five- and ten-year periods. All in all, it was a good period for stocks, which includes the impact of a 100-year pandemic.

Bond Markets

The Yield Curve to the right illustrates the pattern of observed returns from holding bonds to term across several maturities. Today these yields go from essentially zero to about 2% across a twenty-year spectrum. Yields remained low and didn’t change much over the most recent quarter, reflecting the Fed’s desire to continue to stimulate the economy by keeping rates low. Over the past year yields at the longer end increased, which had a negative impact on bond returns – an index of longer-term Treasury securities maturing between 7 and 10 years lost 4.3% over the last twelve months.

Capital Market Signals

A steadily rising stock market and negative real bond yields are not the signals we expect from capital markets. Models of stock behavior tell us that prices reflect available information about cash flows over an uncertain future, which as new information unfolds will cause them to move up and down randomly. Additionally, we have always thought that people must be paid with a positive expected return to give up consumption to invest. A consistently increasing stock market and negative bond yields are inconsistent with these models of capital market behavior.

One thing that is different this time around is that the Fed has become a major player in capital markets. Through its Quantitative Easing programs in response to the financial meltdown in 2008 and the Covid-19 pandemic in 2020, it has purchased massive amounts of U.S Treasury and mortgage-backed securities – it holds over $8.0 trillion of these assets on its balance sheet today. This activity not only reduces the downside risk to stockholders, but also has driven nominal interest rates to zero. Knowing the Fed stands ready to provide liquidity to lessen the impact of economic shocks creates a willingness for investors to take on risk. The moral hazard from the Fed’s activities helps to explain the steady rise in stock prices. Additionally, negative bond returns mean stocks are relatively more attractive.

The Fed continues to signal the continuation of the current monetary policy, although it may soon begin to “taper” its monthly bond buying program. It is not clear what will result in the Fed being less involved in capital markets and what penalties will be paid from either continuing to be a major player in markets or moving away from its dominance.

Some of us still yearn for a simpler time, when we could expect to retire and live comfortably on interest and dividend income from our investments.  Protecting the principal of our nest egg would allow us to live many happy years without fear of running out of money.  Of course we may still want to take some stock market risk, in the hope that rising stock prices would increase our principal value enough to offset the impact of inflation.  Ideally, the growth in principal value would allow our income to grow enough to maintain its purchasing power.

If only it could be that simple.  In the 1950’s dividend yields exceeded 5% and in the 1970’s and 1980’s dividend yields averaged more than 4% on the S&P 500.  By March 2000 dividend yields had dropped below 2%, but the ten-year Treasury was yielding 6.2%, so a diversified portfolio could still generate income.  Times have changed.  Today, the dividend yield on the S&P 500 is 1.4%, and the yield on ten-year Treasury bonds is hovering around 1.5%, while inflation expectations are 2%, and maybe a good bit higher in the short term.  A diversified portfolio will not provide much income, and a bond portfolio will not maintain its purchasing power, even if all the interest is reinvested.

Is Spending Principal Bad?

Not necessarily, but it can be.  Take the example of municipal bonds, which are often issued with large coupons, so today you can purchase a ten-year tax exempt bond with a 4% coupon, or interest payment.  It sounds good, but there is a catch.  You have to pay $122 today for every $100 of face value, which will be the amount of principal returned to you ten years from now.  Over the ten year period you will receive 4% of face value, but that really represents interest income (yield if held to maturity) of 1.47% while the rest is an early return of your principal.   If you spend the 4%, you are spending part of your principal, and will have only $100 to reinvest (rather than $122) when the bond matures.

Total Return Can Provide Cash Flow And Protect Purchasing Power

The total return on stocks (dividends plus price appreciation) is more important than ever in a diversified portfolio that needs to provide current cash flow and protect purchasing power for the long term.

Stocks tend to appreciate in value, so selling a few shares of stock can be the best way to meet cash flow requirements.  Of course stock prices go up AND down, so selling stock can feel like you are spending down your principal, and no one wants to do that.  The fear of spending principal should be put in perspective.  The average annualized return on the S&P 500 from 1950 to 2020 was 11.2%, which includes 3.3% from dividends and 7.9% from price appreciation.  The 7.9% was not income, and could only be spent by selling shares.

Some Things Are Different And Some Things Are Not

With low interest rates, and low inflation expectations, we should expect a lower total return from stocks than what we observed on average from 1950 to 2020, and of course no one can predict stock movements in the short run.  However, we expect the total return on stocks to be meaningfully better than cash or bonds, so understanding how to use the total return to fund retirement spending will continue to be important for a comfortable retirement.

Managing portfolio risk, monitoring asset allocation, rebalancing, and managing cash flow are all part of what we do at Rockbridge.  Let us know if you would like to discuss how your investment portfolio will fund your future cash flow needs.

Stock Markets:

Stocks provided positive results over the most recent twelve-month period. While all markets have done well, especially stocks in domestic markets, the markets that lead and lag vary across the various periods.

While not shown in this chart, a globally diversified stock portfolio earned over 12% over the three-year period ending June 30th, which includes both the sharp fall-off due to the Pandemic and the recent snap back. These results once again demonstrate not only the futility of trying to predict markets, but also the importance of staying invested throughout market ups and downs.

Bond Markets:

The Yield Curve below shows the pattern of observed returns from holding bonds to term across several maturities. Today these yields go from essentially zero to about 2% across a twenty- year spectrum. Yields for bonds of longer maturities fell a bit over the last quarter, which had a positive impact on those bond returns. Over the past year, on the other hand, yields have increased bond returns negatively – an index of Treasury securities maturating between 7 and 10 years lost 4.7% over the trailing twelve months.

Today’s Investment Landscape: Is there a piper to be paid?

In response to the Pandemic, the Government has run massive deficits and the Fed has re-implemented“quantitative easing”, which has been largely successful. The domestic economy is coming back, and employment has rebounded. The stock market as measured by the S&P 500 is up just over 40% and interest rates continue at historic lows. While successful to date, it is unknown if we will eventually have to pay the piper with higher interest rates and sustainable inflation down the road.

Conventional macroeconomic models tell us that deficits can produce inflation. Additionally, increasing prices may reflect temporary dislocations in this unique period. The sharp ups and downs of lumber prices are an example of the temporary nature price changes. The Fed governors and many commentators argue that this price activity will be short- lived and are reasonably calm about the prospects for sustainable inflation.

The Fed has been a massive buyer of U.S. Treasury securities and helps to explain why Treasury yields are at historical lows. However, when (if) the Fed begins to sell these Treasuries to bring its balance sheet back to more normal levels, unless done carefully, could drive bond yields back up.

The Long-term:

Today’s investment landscape is cluttered with many unknowns. The long-term is best thought of as the time it takes for actual results to equal what is expected, i.e., “regress to the mean”, which can be a long time and requires patience. Below average results in any market will not necessarily continue and above average results will not persist either. After the recent sharp run-up in stock prices, many of the metrics used to gauge market results signal a fully valued market. Markets can snap back quickly and getting out prior to earning what is expected will only assure below average results.

Stock Markets

Stocks continued to climb in the first quarter and these results are signaling a robust economy ahead.  Markets have made a dramatic rebound since the sharp fall in the first quarter last year.  Look at the returns over the past twelve months in the chart to the right.  Also note that stocks traded in domestic markets have outperformed in all periods.  However, avoid extrapolating past results over long periods into the future.

Recent periods demonstrate the importance of diversification, which is the only “free lunch” in investing; it can increase expected returns without increased risk.  To realize these benefits it is necessary to buy low and sell high; and while this sounds easy, it is not.

Monitoring a diversified portfolio must also be done with care. The usual process is to compare results against popular indices.  Yet, a diversified portfolio will always behave differently from these benchmarks.  Making good long-term decisions means understanding variances, not just measuring them. The slight variations among the portfolio’s allocations versus that of a benchmark is apt to have a profound impact – comparisons must be done with care.

Bond yields at the longer end were up in the first quarter – the bellwether 10-year Treasury yield was up 0.8% this period.  Short-term yields stayed at zero reflecting the Fed commitment to keep interest rates low.  Bond returns are inversely related to changes in yield, which meant returns of about zero on short-term bonds – an index of long-term Treasury bonds was down almost 6% this quarter.

Bond Markets

The Yield Curve shows the pattern of yields to maturity of U.S. Treasury securities over several maturities can be thought of as a series of expected future short-term interest rates through time.  The difference between the one-year yield and 10-year yield on Treasury securities is about 1.75% today.  While the absolute levels of bond yields are low, this difference is large by historical standards and may be signaling higher rates ahead.

The Fed has been fighting the pandemic-induced recession by doing the best it can to keep interest rates low.  Even though the Fed has announced it will maintain this strategy over the next few years, a more robust economy will provide cover for a rise in interest rates.

Based on the steepness of today’s Yield Curve, a robust recovery and extraordinary government spending, “up” is the most likely answer to the question:  Where are interest rates going?  We will see.

Inflation

Inflation is beginning to be a concern. The $1.9 Trillion stimulus package plus talk of a $2 Trillion Infrastructure package all on top of a $3.1 Trillion deficit is unprecedented and brings uncertainty.  The inflationary impact of spending to lessen the pain of a 100-year pandemic if managed well can be temporary.  However, stimulus spending in a sharply growing economy, which many expect, can produce a sustained upward pressure on prices.  Although there is no sign of anything that looks like inflation yet, from a historical perspective the ingredients are there.

Stock Markets

Results over the past quarter are consistent with positive expectations due to the introduction of vaccines in November. Small company stocks and Real Estate markets have snapped back but not enough to bring the past year’s Real Estate returns into positive territory. Over longer periods, domestic stock markets have outpaced international and emerging markets.

Bond Markets

The Yield Curve shows the pattern of observed returns from holding Bonds to term across several maturities. Today these yields go from essentially zero to about 1.5% across a twenty-year spectrum. Yields have dropped since a year ago, which explains positive returns over the past year, especially those for longer maturity Bonds. On the other hand, yields have increased at the long end of the curve over the most recent quarter, impacting returns for longer dated Bonds negatively.

The slope of today’s yield curve has steepened over the past quarter which is consistent with expectations for increased interest rates.

A Perspective on 2020

2020 gave us one extraordinary event after another: a hundred-year pandemic that has taken over 350,000 American lives; lockdowns and quarantines producing massive unemployment and a deep recession; a government in disarray capped off by a contested Presidential election; Black Lives Matter protests; one hurricane after another; and unrelenting wildfires across the West. Now, we have scientific break throughs producing Coronavirus vaccines in record time. This development plus an essentially resolved Presidential election means we can begin to see a “light at the end of the tunnel.” Signals from capital markets seem to be telling us so.

Throughout the year capital markets responded to these events. Not only were stocks volatile but Bond yields dropped significantly as monetary policy and markets reacted to the onset of the pandemic and remained close to zero. Yields on inflation-adjusted Bonds like TIPS dropped below zero and stayed there.

During 2020 the stock market returns were not only volatile but were inconsistent among the various markets. Over the first nine months the largest U.S. Tech companies fared reasonably well – other markets fell short. Those who told us the “market” came back after the initial fall off in March were only talking about the S&P 500, which is driven by these largest Tech companies. The numbers tell this story: Over the period ending September 30th, the S&P was up nearly 6% while a globally diversified portfolio was off almost 8% – a 14% difference. With the announcement of an effective Coronavirus vaccine in November we get a different story. While all markets were up in the fourth quarter the S&P 500 did not keep pace – the worldwide portfolio earned 20% versus 12% for the narrowly focused S&P 500. All in all, however, stocks earning better than 10% over this truly extraordinary year is not bad!

With the onset of the pandemic, Bond yields dropped significantly and have remained low. While yields at the short end, which are most affected by the Fed, remain close to zero, yields at the longer end have increased in recent months, which is consistent with expectations for an improving economic environment. Bonds were strong in 2020– earning from 3% to 10% over the year depending on maturity. Most of these results came in the first quarter after the sharp fall-off in yields.

Markets look ahead and recent activity is consistent with positive expectations for a recovery from the effects of the Coronavirus vaccines. As the economy improves, perhaps the Fed will feel less inclined to drive interest rates to zero. There is no doubt that the cost of money is at rock bottom and readily accessible. With this availability and a pent-up demand in both the private and public sectors, it is reasonable to expect an improved economic environment. While many uncertain ties remain, a pickup in the economy could produce more reasonable stock and Bond markets. Yet, 2020 was a stark reminder that markets are driven by surprises. Today’s environment feels a little more comfortable, and perhaps we can hope for positive surprises out-weighing negative surprises going forward.

2018 was a less pleasant time to be an investor. In the four trading days leading up to last Christmas, the market dropped 7.7%, capping off what was a nerve-racking year for investors. But when we delved deeper, we found that 2018’s volatility wasn’t that unusual.

One measure of market volatility is looking at the number of days in which the market moves more than 2% in either direction. Since 1928, the stock market has annually averaged 17 such “volatile days” and over the last 30 years, the average stands at 16.

In 2018 we had 20 volatile days, making it more volatile than usual but not horribly so. One of the reasons it felt so volatile was because prior years lacked volatility, including 0 volatile days in 2017. Overall, 2019 was a pleasant year to invest. The market had a smooth ride with U.S. large caps up around 30% at the time of this writing, making 2019 the 17th best year since 1928.

This year we only saw 7 days of high volatility and two of those had happened by January 4 . In August we witnessed three such

days, all negative movements, as investors began to fret about an upcoming recession. However, the slow-down has not materialized and the market rallied to close out the year.

It pays to be invested and part of the reason long-term returns are so good is because it’s not easy to stomach market losses when things are bad. Staying grounded is key; when we have years like 2018 it’s important to remember the years like 2019 and vice versa.

Unfortunately, bad times will come, and when they do, we can take comfort remembering we’ve survived worse. In 1932, there were 133 volatile days, more than half of the year’s 250 trading days. The stock market dropped 43%, nominal GDP declined 23%, the dollar deflated 10%, and unemployment stood at 24%… but hey, the U.S. cleaned up at the Los Angeles Summer Olympics (in fairness, the number of countries participating declined 20% from 1928 to 1932 due to cost).

So, what’s the lesson here? Volatility is normal and we can’t predict its arrival. 2019 was a low volatility year with great returns while 2018 was the opposite. However, being invested through both has made Investors better off. Stay invested, diversify, and rebalance when volatility strikes (buy low, sell high). This isn’t always easy to do, but it’s one of the main reasons we are here as your financial partner.

Last week, we introduced you to our weekly Investment Committee meetings. When we met for class on 4/27/18, we began our discussion on the subject of an “optimal portfolio.”

The centerpiece of investment management is portfolio construction. Alongside financial planning, the manner in which one’s money is invested is critical to meeting one’s financial goals.

Before attempting to construct the best portfolio possible, it is important to identify some core beliefs when it comes to investing. There are many, but a few we would like to highlight are:

  • Markets are efficient: By and large, the best estimate of the true intrinsic value of a stock or bond is whatever price the security is currently trading at. Free lunches almost never exist, though in hindsight may seem obvious. No one really knows what will happen to the market tomorrow or the next day.
  • Only take systematic risk: When you own the broad stock market, you are exposed to variability in the value of your investment (risk). When the economy is good, a diversified stock portfolio will go up, and when recessions hit, it will go down. The investor is rewarded for taking that risk. Over time markets go up, but the ride is bumpy. When one owns individual stocks, they are still exposed to that same economic risk. However, they are also exposed to company specific risk. The company specific risk associated with each individual stock averages together to get the broader market, meaning on it’s whole provides no additional return. By concentrating your investments into specific holdings, you are exposing yourself to increased risk without improving expected returns.
  • Risk and return are highly correlated: As markets are efficient, and assuming only systematic risk is being taken, the more (less) risk you are taking the higher (lower) your return should be over long periods of time. Since 1926, U.S. stocks have averaged a 10% return. If you were told going forward you’d get 10% every year, everyone would sign up, driving the price up until the expected return was lower. The fact that the market can be up or down 40% in a year is what makes it risky and along with that comes a return.

Keeping these “truths” in mind, we construct an optimal portfolio with the goal of achieving the following things:

  • Achieve the highest risk-adjusted return: Through the application of modern portfolio theory, we want every portfolio to deliver the largest return for a given level of risk. Financial advisors and investors together are responsible for determining how much risk the investor can and should take. At that point, we find the combinations of investments that deliver the highest expected return.
  • Keep costs low: Research shows that paying too much in fees and commissions eats into returns. Keeping costs low and achieving market returns in the most efficient manner is the proven way to build wealth.
  • Simple and customizable: Research has shown a few factors drive returns. Introducing a multitude of strategies and products generally complicates things, often driving costs up without improving returns. Additionally, every client is unique and an optimal portfolio must be customizable to their specific situation. Whether it’s a legacy stock position with large capital gains, or an employer sponsored retirement account with poor/limited investment choices, an optimal portfolio needs to be able to be customized. Simplicity meshes better with customization than complexity.

Having a plan and sticking with it is critical when it comes to investing. Cognitive and behavioral biases cause people to make emotional decisions which harm their financial well being. Understanding and buying into the investment management piece of one’s finances, helps the investor and the advisor stick to the plan and avoid the mistakes that harm most investors.

Introduction

People from all across the world look forward to Friday.  Friday marks the end of a (usually long) work week and the start of what is supposed to be a relaxing weekend.  At Rockbridge, we look forward to Friday’s, particularly Friday mornings, for a different reason.

Friday mornings have become a tradition, some say a “tradition unlike any other” (not the masters), where great minds (some) sit around our conference room table and discuss the core principles of our investment philosophy and what, if any, changes should be made to our portfolios.  These meeting are led by Bob Ryan, Rockbridge’s Chief Investment Officer, and topics include anything and everything investment management related.

The purpose of these weekly articles is to inform clients what we are discussing each week and how it relates to their wealth at Rockbridge.  Our investment philosophy is proven in academia and the ideas we implement in our portfolios have been around for several years.  It’s important to us to not have a “whimsical” approach to managing wealth; something we see all too often in the investment management world.  Although we are seen as a financial planning/wealth management firm in the eyes of our clients, investment management and portfolio construction is the backbone of this process.

We hope to provide valuable insight on our Friday meetings; what some have coined “Bob’s Investment Class.”  This marks the beginning of a series of weekly posts sharing some of these ideas with you.

Thoughts from Friday 4/20/18

Mike, Ethan, and Claire, attended the Dimensional Fund Advisors (DFA) conference in New York City this week and came away with some interesting ideas for our Friday discussion.

Topic: Corporate Bond Credit Risk Premium

There are risks to consider when investing in the bond market, one being credit risk.  Credit risk is the risk of a bond “defaulting”, and in a normal market riskier bonds will have to entice investors by providing higher coupon payments.  We ran across data suggesting that bonds with lower credit quality have similar default rates to similar bonds with higher credit quality.  This begged the question of “why not invest in riskier bonds and pocket the higher coupon payment if said bonds have the same default rate as  similar higher quality bonds?”

One of our core rules is to be suspicious of any “free lunches” when it comes to investing; achieving a higher return without enduring additional risk, which is what we see here.    This situation is no exception to our core beliefs.

We discussed that although increasing credit risk in the bond portfolio might not result in a higher default rate, it would actually increase the correlation to the equity portfolio.  Bonds should be inversely correlated with equities, and increasing credit quality too much creates positive correlation to equities; meaning equities and fixed income would behave similarly, something we don’t want to happen.  Bonds provide a “buffer” in the portfolio, helping to “smooth out the ride.”  For example, in 2008 the Barclay’s Aggregate Bond Index finished the year earning 5.24% while the S&P 500 Index finished losing nearly 37%.

In summary, the role of bonds is much more than the eye sees.  Sure, we could increase expected bond returns by exposing portfolios to more credit risk, but we would increase the correlation between the stock and bond components of the portfolio as well.