




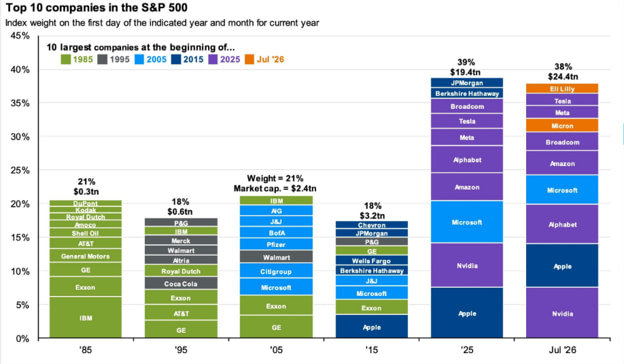

Capital Markets Activity
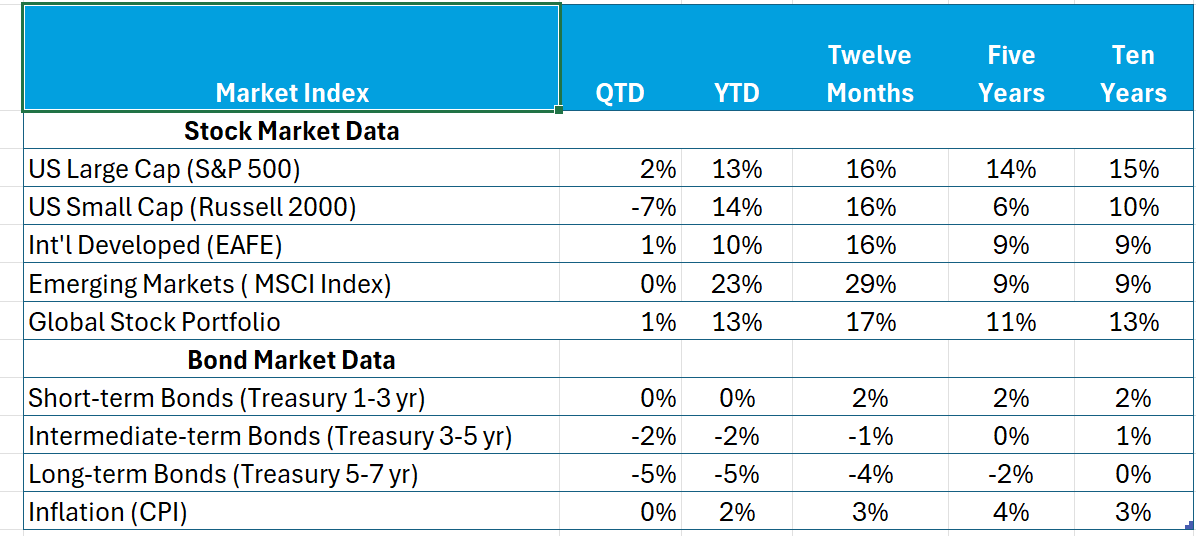
Stock returns were mixed this quarter. AI stocks rebounded nicely. Bonds, especially for longer maturities, were down reflecting rising yields. Here’s the data:
Stock Markets
The return of the S&P 500 Index led all other market indices this quarter. The AI-dominated Magnificent Seven stocks explain much of this result. The equally weighted S&P 500 Index was up nearly 2% for the quarter, which demonstrates the importance of the largest tech stocks to this quarter’s results. While domestic small cap markets (Russel 2000) were off, the index is up nicely year-to-date, demonstrating the need to endure volatility to realize the expected returns of this market.
While recent periods have been good for stocks, uncertainties remain. These include eventual payoffs from the substantial investments in Data Centers; resolution of the war with Iran and energy prices; massive deficits; inflation and Fed monetary policy; and political dysfunction. How these uncertainties are resolved will affect future stock markets. In the meantime, expect continued volatility.
Bond Markets
Bond returns are down this quarter due to rising yields, which jumped nearly 1% for maturities between two and ten years. The yield on the bellwether 10-yr. Treasury moved from 4.4% to 5.3% over the quarter. Notice that negative returns increase with maturity and are indicative of the inverse relationship between yield changes and maturity on bond prices and returns.
While rising yields push bond prices and returns down, yield is what’s earned if the bond is held to maturity. Yields at today’s levels are more attractive than in the recent past, making commitments to bonds more important to portfolio results going forward.
Bond Yields, Deficits, Data Centers, and Market Risks
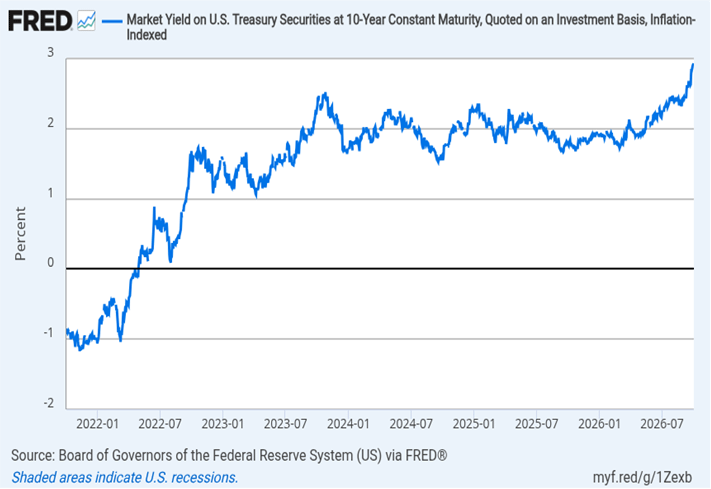
In just this last week the yield on the 10-yr. Treasury breeched the 5% mark, up nearly 0.5% this month producing increased worry about the path of interest rates. The increases in yield reflect pressure from underlying interest rates. They are not driven by increased expected inflation as the spread between nominal and inflation-adjusted yields at five and ten years remain constant at 2.3%, close to the Fed’s stated objectives.
The accompanying chart shows the path of inflation-adjusted (real) rates since January 2021. Note the increase from an unsustainable (less than zero) level in response to Covid, to today’s levels in the more typical range of 2% to 2.5%.
Interest rates respond to demand for capital and monetary policy (while the Fed controls directly only the short-term Fed Funds rate, long-term rates reflect expected short-term rates). Today the two primary demands for capital are funding data centers and government deficits. The eventual payoff from capital invested in data centers is especially uncertain and is a new dimension of risk. The need to refinance massive deficits at higher interest rates makes the cost of these deficits more apparent, another source of uncertainty in the bond market.
Today’s bond yields are consistent with the expectation that the Fed will keep inflation in check with monetary policies without affecting economic activity adversely – which is a fine line that contributes to today’s uncertainties and volatile markets.